Principles of Graph Construction
-
Graphical Perception
-
Principles
GRAPHICAL PERCEPTION
Goal: Communicate information
Author (you) -> graphic -> Reader
A graph is more effective than another if its quantitative information can be decoded more quickly or more easily by most observers.
Nancy Robbins, Creating More Effective Graphs
Pattern perception depends on
Detection: recognition of geometry encoding values
Assembly: grouping of detected symbol elements
Estimation: assessment of relative magnitude of values
A hierarchy of human graphical perception abilities
-
Position along a common scale (most accurate task)
-
Position along identical nonaligned scales
-
Length
-
Angle and slope
-
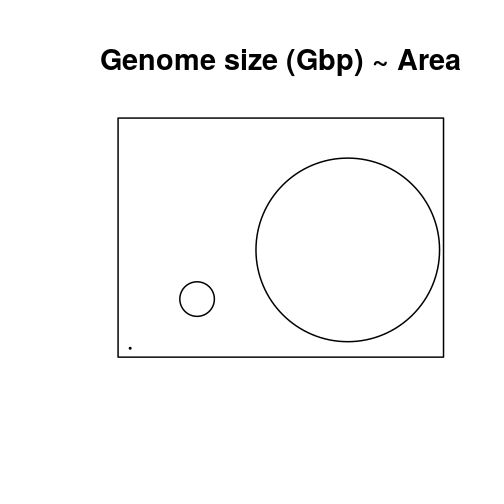
Area
-
Volume
-
Color: hue (red, green, blue, etc.), saturation (pale/deep), and lightness. Hue can give good discrimination but poor ordering.
PRINCIPLES
-
Show the data
-
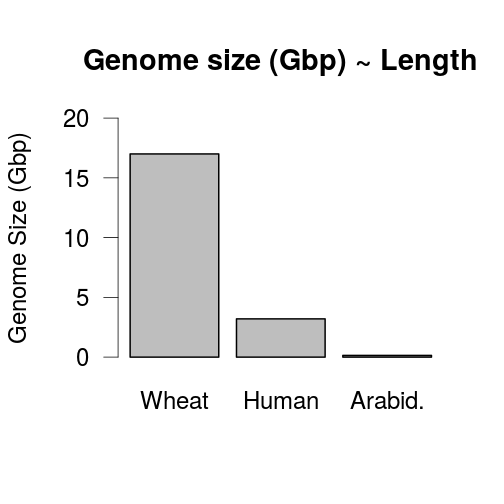
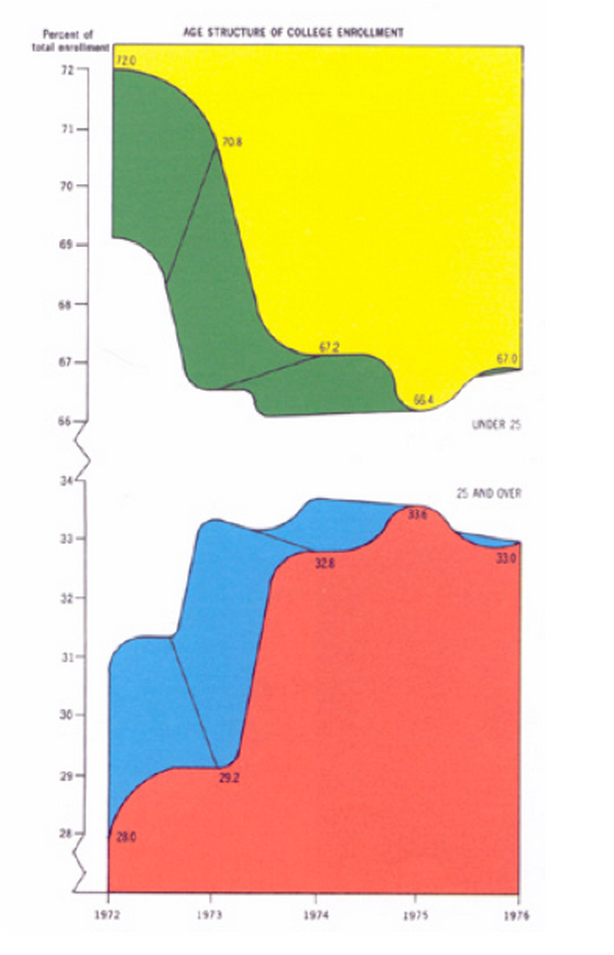
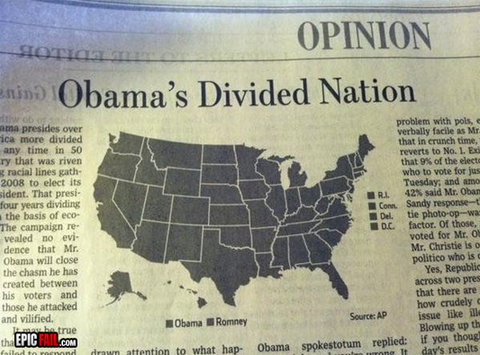
Avoid distorting the data
-
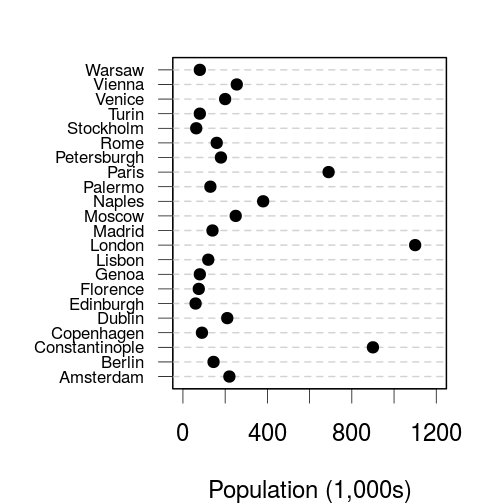
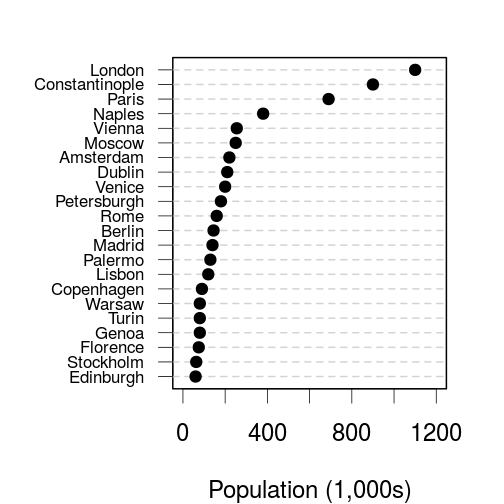
Aid comparisons
-
Maximise data:ink
-
Label data, minimize legends
-
Use clearly different symbols, colours
-
Consider 0
-
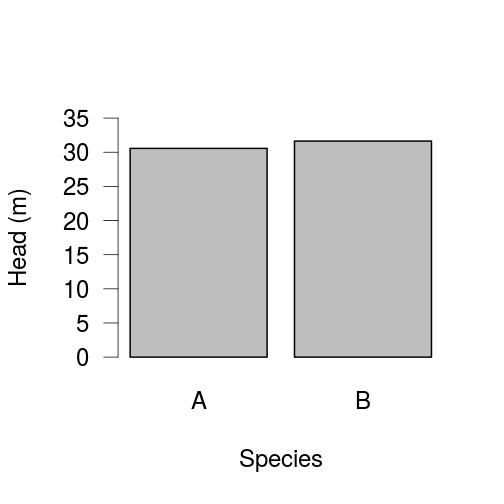
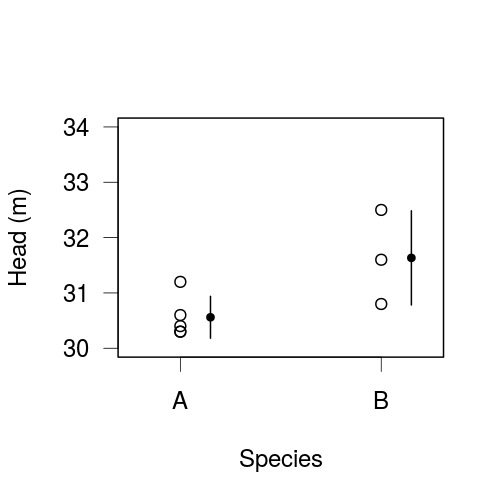
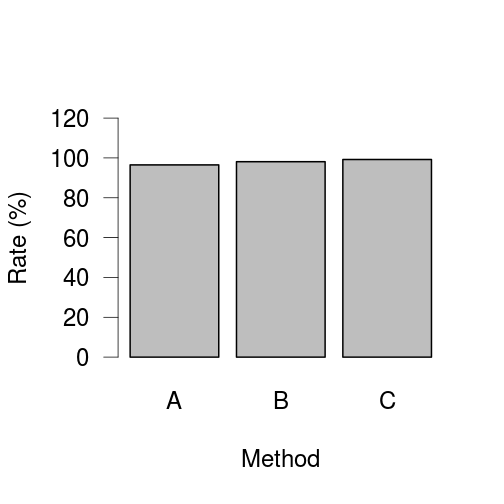
Dot plots are often better than bar charts
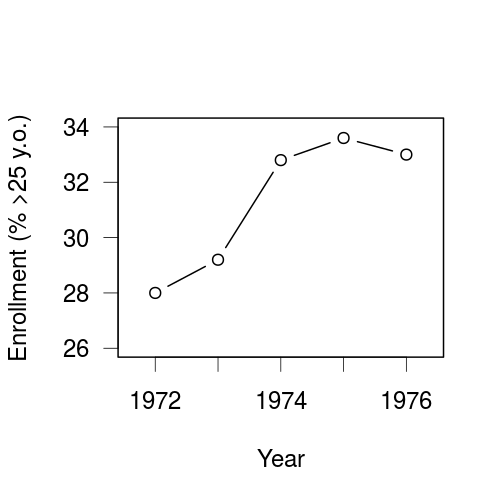
1. Show the data
vs
2. Avoid disorting the data
vs
3. Aid comparisons
vs
4. Maximise data:ink
vs
5. Label data, minimize legends

6. Use clearly different symbols, colours
7. Consider 0
vs
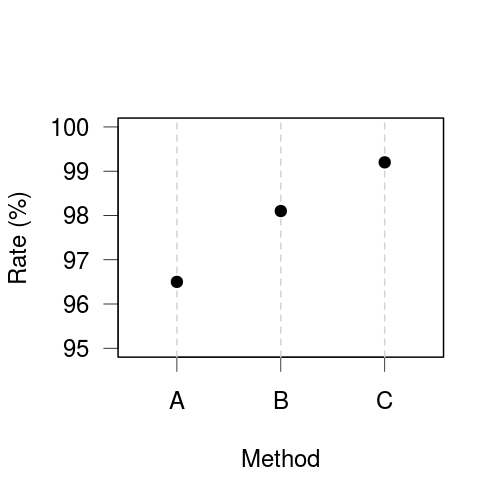
8. Dot plots are often better than bar charts
Bar charts:
-
High ink:data ratio
-
Error bars cause perception errors
-
Can only show one-sided confidence intervals well
-
Thick bars reduce the number of categories that can be shown
-
Labels on vertical bar charts are difficult to read
9. Less is often More